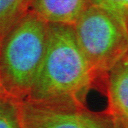
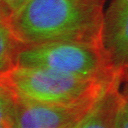
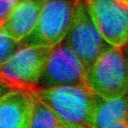
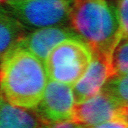
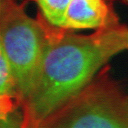
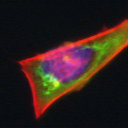
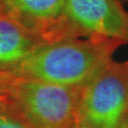
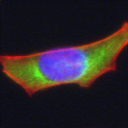
 After training on the BBBC021 dataset, a Linear Discriminant plan (LDA) is computed in W from generation of 3000 random seeds
for each of the 3 following conditions: DMSO (untreated) and highest concentrations of Nocodazole and cytochalasin B.
Random seeds with intermediate concentrations of nocodazole are then projected onto the same plane.
This panel shows that these consecutive concentrations form a path between DMSO and the highest concentration.
Following this path, it is possible to compute gradual phenotype changes along the dose response for the same seed. Interestingly
orthogonal projection of these points to the latent traversal (the direct line between DMSO and the highest concentration)
produces close image results and could therefore be used as an approximation of the dose response. All displayed imaged are synthtetic.
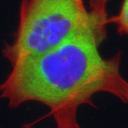
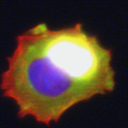
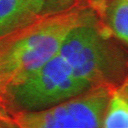
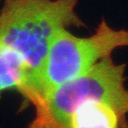
After training on the BBBC021 dataset, a Linear Discriminant plan (LDA) is computed in W from generation of 3000 random seeds
for each of the 3 following conditions: DMSO (untreated) and highest concentrations of Nocodazole and cytochalasin B.
Random seeds with intermediate concentrations of nocodazole are then projected onto the same plane.
This panel shows that these consecutive concentrations form a path between DMSO and the highest concentration.
Following this path, it is possible to compute gradual phenotype changes along the dose response for the same seed. Interestingly
orthogonal projection of these points to the latent traversal (the direct line between DMSO and the highest concentration)
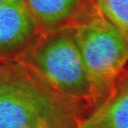
produces close image results and could therefore be used as an approximation of the dose response. All displayed imaged are synthtetic.Example 1
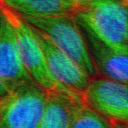
DMSO
Nocodazole
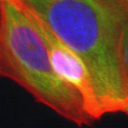
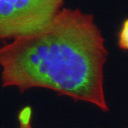
Example 2
DMSO
Nocodazole
Example 3
DMSO
Nocodazole
Example 4
DMSO
Nocodazole
Example 5
DMSO
Nocodazole
Example 6
DMSO
Nocodazole
Example 7
DMSO
Nocodazole
Example 8
DMSO
Nocodazole
Example 9
DMSO
Nocodazole
Example 10
DMSO
Nocodazole
Options