Phenexplain Demonstration
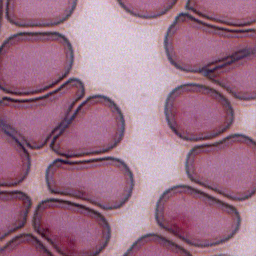
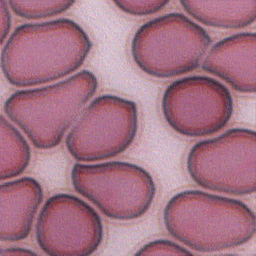
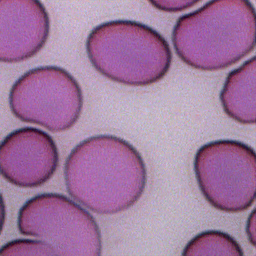
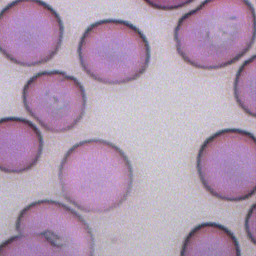
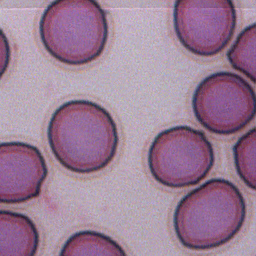
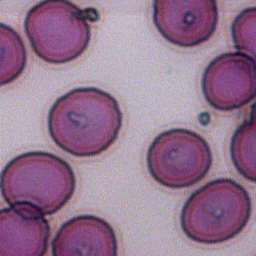
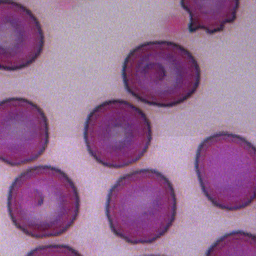
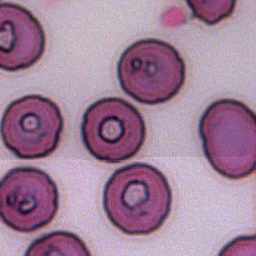
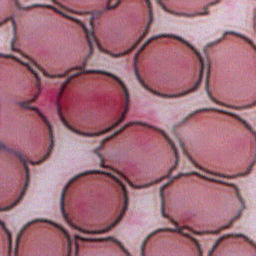
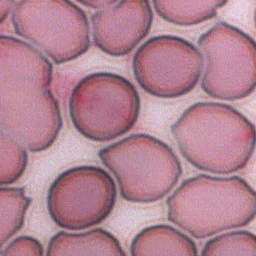
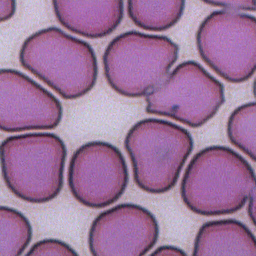
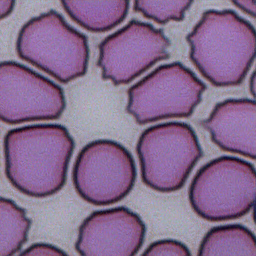
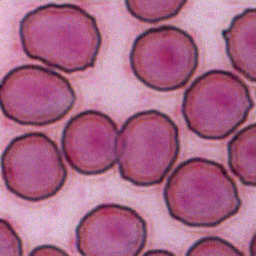
 In this example, training was performed on images of red blood cells extracted from thin blood smears sampled from a population of
people exposed to malaria. The 200 slides used were diagnose as negative to
Malaria by microscopists, meaning no parasites could be found on
any of these slides. Nevertheless half of these slides were assessed as positive by
qPCR. On original qPCR negative and qPCR positive slides, images
displayed variable cell densities with variable background,
did not contain any parasites, and did not show any identifiable
systematic visible differences. Here, the system enables us to clearly distinguish
anemia cells and crenated cells, as well as a bias due to staining. All displayed images are synthetic.
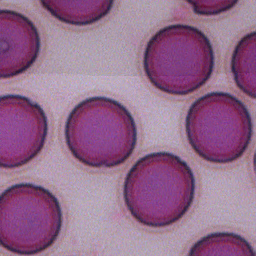
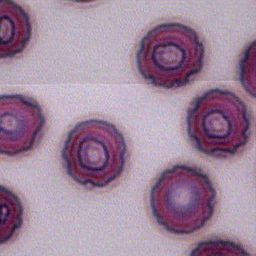
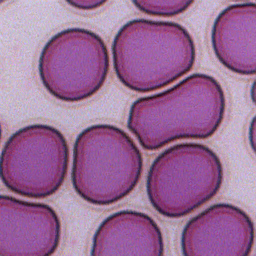
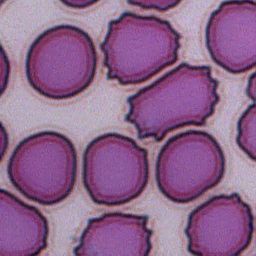
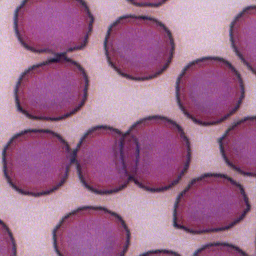
In this example, training was performed on images of red blood cells extracted from thin blood smears sampled from a population of
people exposed to malaria. The 200 slides used were diagnose as negative to
Malaria by microscopists, meaning no parasites could be found on
any of these slides. Nevertheless half of these slides were assessed as positive by
qPCR. On original qPCR negative and qPCR positive slides, images
displayed variable cell densities with variable background,
did not contain any parasites, and did not show any identifiable
systematic visible differences. Here, the system enables us to clearly distinguish
anemia cells and crenated cells, as well as a bias due to staining. All displayed images are synthetic.
Example 1
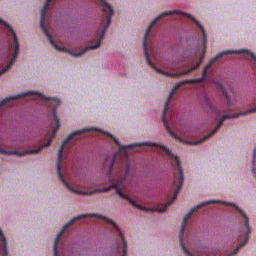
qPCR negative
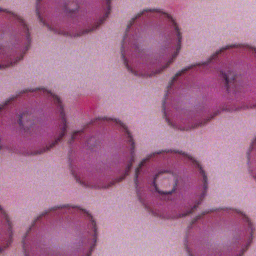
qPCR positive
Example 2
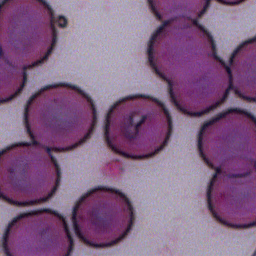
qPCR negative
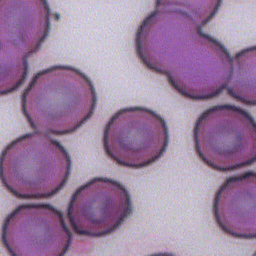
qPCR positive
Example 3
qPCR negative
qPCR positive
Example 4
qPCR negative
qPCR positive
Example 5
qPCR negative
qPCR positive
Example 6
qPCR negative
qPCR positive
Example 7
qPCR negative
qPCR positive
Example 8
qPCR negative
qPCR positive
Example 9
qPCR negative
qPCR positive
Example 10
qPCR negative
qPCR positive
Example 11
qPCR negative
qPCR positive
Options